Few things are more painful than running 50-plus miles one way, trolling offshore all day, then coming home with an empty fishbox. Ripping open 20-pound bags of unused ice and dumping the cubes over the side rubs salt in your wounds. Refilling near-empty fuel tanks is utterly excruciating. Throwing away packs of thawed ballyhoo adds insult to injury. Then — oh joy! — you get to clean the boat and gear. That’s why offshore anglers generally do everything humanly possible to stack the deck in their favor, perhaps more so than any other type of fishermen. And one of the ways they make it happen is by checking sea surface temperature (SST) data. What some folks may not realize is that from their vantage point 20,000-some miles up in the sky, today’s satellites can deliver a whole lot more.
Harnessing SST for Offshore Fishing
SST remains the basic building block of satellite-provided fishing intel, so before we go off in any other directions let’s make sure everyone has a handle on it. SST charts provide you with a satellite’s view of water temperatures, showing the boundaries between different water masses as they collide, shift, and move with the currents. These boundaries are critical, because in a fish’s oceanic world they’re structure. Where different bodies of water meet they create a “break,” visible via temperature, where they grind against each other. In doing so masses of plankton, weeds, and other items at the mercy of the currents get squeezed together into concentrations. Then, predators move in to enjoy the buffet.
Some temperature breaks are more significant than others and some are better defined than others. As a general rule of thumb the bigger and more abrupt the temperature difference is, the better. Then, look for anomalies in the break like fingers or bulges. Next, look for areas where breaks interact with physical structure like canyons or the edge of the Continental Shelf. The more of these fish-attracting factors you can piece together, the better your chances of pointing the bow in the right direction when you leave the inlet at zero-dark-early in the morning.
Subsurface SST
Some fishing services — though not all — can also provide you with temperature charts for subsurface waters, in some cases down as far as 90 feet. This gives you another complete dataset to work with; the same principals are at play but now working in multiple dimensions, and you may discover that there are strong temperature breaks that look very attractive from a fishing standpoint but which were hidden from the view of “regular” SST.
Chlorophyll Charts
We normally think of chlorophyll as it relates to land-based plants, but in this case we’re talking about phytoplankton. Zooplankton naturally gather to graze on the phytoplankton, little critters that eat zooplankton move in, and you know what happens next: buffet time. Just like SST, again, locating breaks or fronts indicates an area fishing might be good, anomalies in the breaks are another item to look for, and interaction with physical structure gets bonus points, too.
Because of the way water bodies shift and move plankton fronts often shadow temperature breaks, so SST and chlorophyll shots will often look similar. But sometimes very strong interactions between the two, or other times a complete absence thereof, will point to the fish.
Okay: you’ve thought about these pieces of the puzzle, you’ve spent hours poring over the data, and you’ve located the hotspot you’ll head for, right? Well, maybe. As is often the case with fishing, once you’ve got it all figured out Mother Nature pitches you a curveball. Currents change. Fronts move. Eddies form and disintegrate. What you look at on the computer screen the night before fishing isn’t necessarily what you’ll find when you arrive at the hotspot. It’s critical to look at days of satellite data to get a handle on the direction and speed of all of the above changes, and take them into account. It’s also critical to have the very latest intel in-hand when you push through the inlet, rather than depending on what the satellites were showing days ago.
Wrapping your head around all this stuff may not seem simple (and there is an easy way out — see the sidebar), but considering the investment in time, money, and lost sleep that offshore fishing requires, satellite data is definitely one card you want stacked in your deck. And hopefully, the next time you head offshore all that ice won’t go to waste.
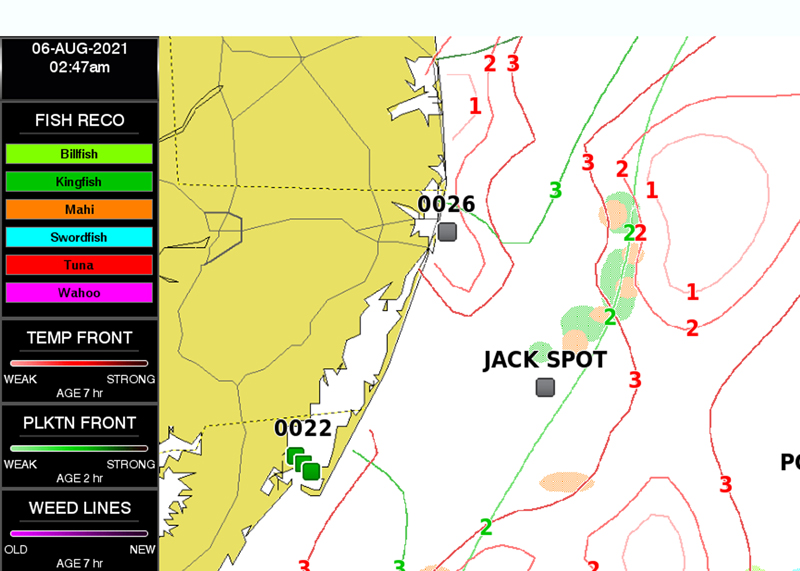
Mapping the Fish
SiriusXM Fish Mapping has been growing in popularity because it not only shows you the raw data collected by the satellites, it also does the interpretation for you. Fish Mapping features all the items we’ve covered here, including SST, sub-surface temperature, and plankton front contours and strength. It also has a few features you won’t see often, including sea surface height anomaly (upwellings and downwellings) and the ability to map the larger weed concentrations.
Timeliness is another strong point of FishMapping, because you can get it piped right to your MFD. That reduces the possibility of looking at a satellite shot the day before fishing, then discovering that it’s moved by the time you arrive on the scene. You can also check all the latest data not only before you leave the dock, but while you’re actually out on the ocean right on your MFD screen (you’ll need a SiriusXM receiver in addition to your Fish Mapping subscription; compatible models are available for Furuno, Garmin, Lowrance, Raymarine, and Simrad MFDs).
Beyond all that, what many anglers find attractive about Fish Mapping is that along with providing all the raw data it can also take a lot of the guesswork out of the game. SiriusXM has oceanographers that check the data and make species-specific recommendations on where to fish, which are overlaid on the charts or on your chartplotter in color-coded species-specific recommendation zones.
We note that in our book, SiriusXM gets bonus points over other services because they’re FishTalk supporters. Whether or not you feel that earns ‘em some extra cred, we’d recommend checking out their one-month free trial offer. Then you can try Fish Mapping and see for yourself if it’s the right satellite service for your personal offshore fishing adventure needs.