Modern technology and the transition from paper charts to electronic navigation charts (ENC) has fundamentally changed how we prepare for fishing trips and navigate our boats. The wealth of information available for our immediate use is as overwhelming as it is helpful. Yet as technology moves forward, older technologies and data sets sometimes have valuable features that are lost to “progress” or made obsolete by new electronic formats. With the continuing transition from raster (scanned and digitized) to vector (digitally built from the ground up) ENC charts, we need to review the status of the Coast Survey’s Automated Wreck and Obstruction Information System (AWOIS) and the National Oceanic and Atmospheric Administration’s (NOAA) Bathymetric Data Viewer (BDV).
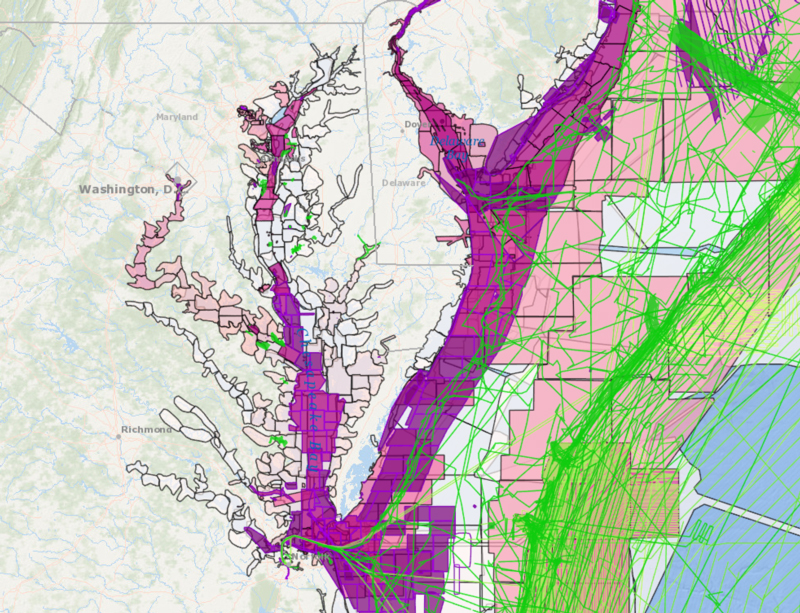
The AWOIS database is a valuable online resource for wreck research and for locating, identifying, and characterizing bottom structure as fishing destinations. AWOIS is, however, a casualty of progress and its database is no longer being updated. Fortunately, it’s being maintained as an online resource, and is accessible using the Coast’s Survey’s Wreck and Obstructions Map Preview. This map viewer also provides access to ENC wreck files. There are thousands of files — the sheer number of shipwrecks is mind boggling. As a hedge against future changes in availability, I downloaded a copy of the entire AWOIS dataset into my electronic packrat file.
Until recently, the BDV had a see-through raster nautical chart with wreck and obstruction symbols which visually flagged the features facilitating their further investigation. That changed in September 2021 when the see-through chart layer was converted to vector charts.
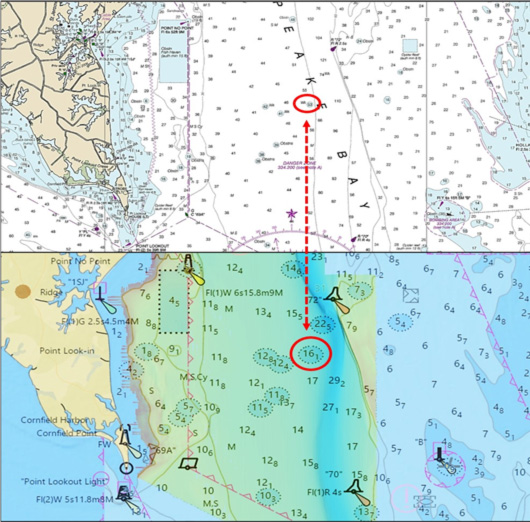
We’ll look more closely at the 53-foot wreck highlighted by the red circle to illustrate the change in display and what you need to look for when using the BDV. Also, note that depth shifted from feet to meters. So, what was a 53-foot least depth wreck in now a 16.1-meter wreck when using the BDV. The ability to toggle between feet and meters is currently not available in this application. The Metric system has been used in hydrographic survey work for some time, although U.S. navigation charts have traditionally used the Imperial system of measurement.
Primary online resources for my fishing reef research are the Bathymetric Attributed Grid (BAG) Color Shaded Relief and Digital Elevation Models (DEM) Color Shaded Relief imaging layers available using the BDV. Placing the see-through raster chart with the wreck and obstruction markings over the BAG, DEM, and combined BAG and DEM images enabled finding charted, uncharted, and inaccurately charted structures. For example, in the Chesapeake Bay, I found a dozen artificial reefs without official documentation under obstruction circles using AWOIS data and BDV BAG imaging (documented in my “Chesapeake Bay Fishing Reef” book series).
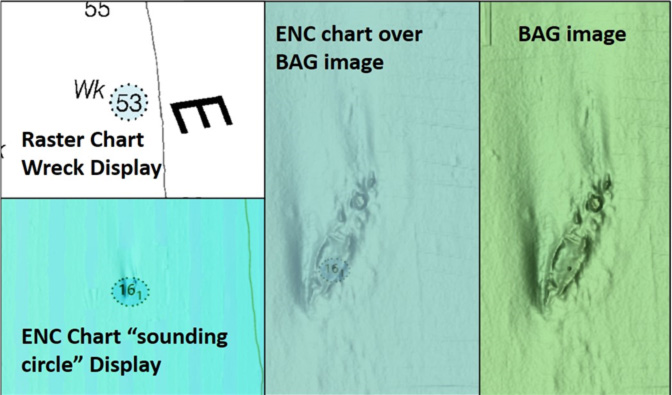
With the conversion of the BDV see-through chart to vector format, most wreck and obstruction symbols are no longer displayed, replaced instead by nondescript “sounding circles” as illustrated in the graphic. The application also had additional BAG Color Shaded Relief data uploaded and the chart layer now can remain displayed at all zoom levels, both positive developments. The downside is that current ENC format makes it more difficult to identify wreck locations in the absence of specific visual icons to draw user attention to them. However, NOAA staff has advised that further updates to the ENC chart service layer are in development with a target release date of late 2021. Prospective updates are anticipated to provide more of the feel of raster charts, including wreck symbols, albeit it without least depth soundings. In the meantime, raster chart images including these data are available as a data layer in the ENC Viewer.
Currently, the BDV doesn’t have a “no basemap” white background layer. The images displayed by the BDV are darker and more washed out than those shown in the graphic which were enhanced so that the sounding circle was clearly visible. The washout effect occurs because the chart is over a colored basemap or other data layer such as “BAG” imaging, and the layered colorations sort of blend together.
The availability of the see-through chart at all zoom levels is helpful for zeroing in on bottom anomalies. However, size of the sounding circle varies by the extent of the zoom. The sounding number is the recorded least depth and placed at the reported coordinates. Many of these coordinates were based on navigation technologies with greater error factors than differential GPS. In fact, for some wrecks and obstructions, the feature isn’t under the circle. So, the actual least depth spot on the feature may very well be offset from where shown. NOAA is aware of this scaling issue for future technology updates.
The BDV remains a valuable armchair scouting aid. As the transition from raster to vector charting continues, those of us who use the BDV will just have to adjust. One approach which I use is to check the AWOIS and ENC mapped wrecks and obstructions and then correlate them with the ENC sounding circles. I’ll switch between windows or place them side-by-side in separate windows. Another approach is to run the BDV and ENC viewers simultaneously in separate side-by-side windows.
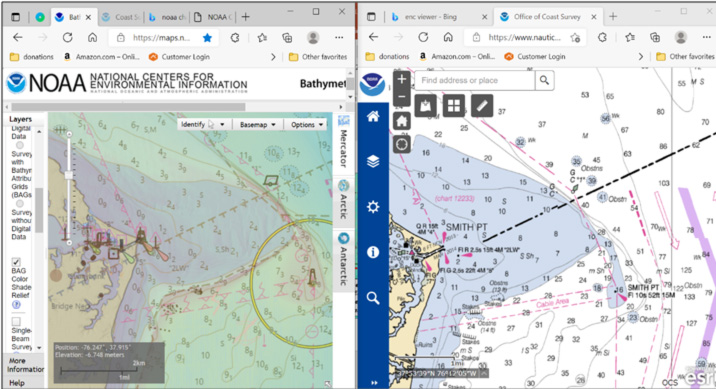
For power users with multiple screens, the BDV, ENC, and AWOIS Viewers can be displayed simultaneously. Most of the time I’ll toggle between screens and scale up the display to make it easier to view with old eyes. Also, when using the ENC see-through chart, I’ll check each shoal-like sounding circle and visually scan under the chart with the BAG layer displayed for uncharted anomalies such as the natural reef and uncharted obstruction. Ironically, charted data in the displayed layer have become less precise while navigation electronics have improved to enable near pinpoint positioning!
-By Wayne Young, the author of “Bridges Under Troubled Waters: Upper Chesapeake and Tidal Potomac Fishing Reefs,” “Chesapeake Bay Fishing Reefs, Voyage of Discovery,” “Phantoms of the Lower Bay,” and “Hook, Line, and Slinker.” All are available at Amazon.com, and you can find his Facebook page at Chesapeake Bay Fishing Reefs.